
The average South Norfolk home sold for £307,735 in August, down 0.2% on a year. Rents rose 3.3% to £984 a month, the second highest in Norfolk.
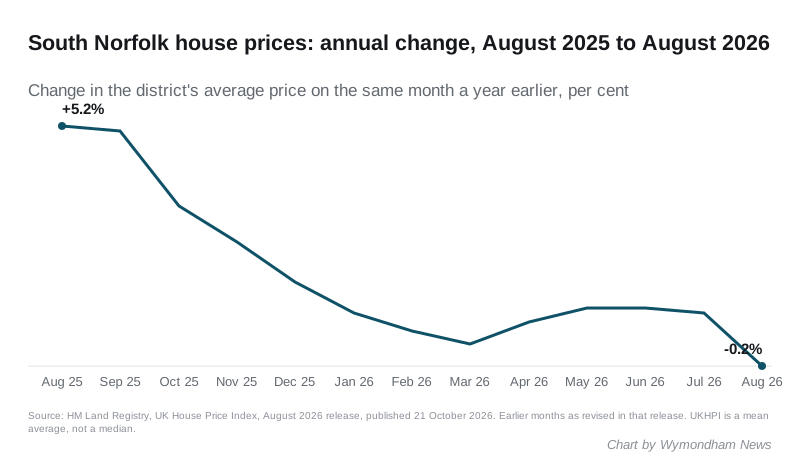
House prices in South Norfolk fell over a year for the first time since September 2024. The average home in the district sold for £307,735 in August 2026, down 0.2% on August last year.
The figures come from HM Land Registry’s UK House Price Index, published on 21 October. The fall is small: £595 on a year. But it is the end of a run of annual rises that started in October 2024.
Renting went the other way. The Office for National Statistics put the average South Norfolk rent at £984 a month in September, up 3.3% on a year.
One caution before the detail. The house price index is a mean average, not a median, so a handful of expensive sales pulls it up. It is built from completed sales, so August’s figure mostly reflects deals agreed in the spring.
A year of slowing, then a dip
A year ago the district’s prices were rising by more than 5% a year. That rate has drifted down almost every month since.
| Month | Average price | Annual change |
|---|---|---|
| August 2025 | £308,330 | +5.2% |
| November 2025 | £312,756 | +2.6% |
| February 2026 | £310,212 | +0.6% |
| May 2026 | £312,566 | +1.1% |
| August 2026 | £307,735 | -0.2% |
August’s average was 0.8% lower than July’s. It is the lowest monthly figure for the district since July 2025, when it was £307,075.
It also leaves South Norfolk £10,814 below January 2023, when the average was £318,549. The district’s index stands at 96.6, against 100 in that month.
Flats fell furthest
Two property types are worth less than a year ago, and two are slightly up.
| Type | August 2026 | Change in a year |
|---|---|---|
| Detached | £422,408 | -£1,554 (-0.4%) |
| Semi-detached | £272,879 | +£1,161 (+0.4%) |
| Terraced | £227,315 | +£224 (+0.1%) |
| Flat or maisonette | £133,133 | -£3,525 (-2.6%) |
| First-time buyer average | £253,657 | +£186 (+0.1%) |
Flats were already the only type falling when we reported July’s figures. They have now fallen further.
How the rest of Norfolk compares
South Norfolk is still the second dearest of Norfolk’s seven districts. Five of the seven, South Norfolk included, are now lower than a year ago.
| District | August 2026 | Change in a year |
|---|---|---|
| Broadland | £313,806 | +2.8% |
| South Norfolk | £307,735 | -0.2% |
| North Norfolk | £286,315 | -4.4% |
| Breckland | £266,835 | -0.3% |
| King’s Lynn and West Norfolk | £266,248 | +2.6% |
| Norwich | £227,535 | -2.0% |
| Great Yarmouth | £204,630 | -1.6% |
Broadland is now £6,071 dearer than South Norfolk. That is the widest gap between the two districts in any month this year.
The averages for the wider areas, from the same release:
- Norfolk: £267,745, down 0.2%
- East of England: £337,848, up 0.2%
- England: £293,525, up 0.4%
Across the Waveney from Diss, Mid Suffolk moved the other way. Its average rose 5.3% to £317,979.
Rents are still rising
The ONS local housing prices page for South Norfolk puts the average private rent at £984 a month in September 2026. That is up from £953 a year earlier.
The rise of 3.3% is lower than the East of England’s 3.8%. The regional average rent is £1,298.
By size, the average South Norfolk rent in September was:
- one bedroom: £698
- two bedrooms: £893
- three bedrooms: £1,112
- four or more bedrooms: £1,579
Only Norwich costs more to rent in Norfolk. The ONS pages for each district give these September averages:
| District | Average rent | Change in a year |
|---|---|---|
| Norwich | £1,148 | about the same |
| South Norfolk | £984 | +3.3% |
| Broadland | £941 | +4.1% |
| King’s Lynn and West Norfolk | £941 | +3.6% |
| Breckland | £935 | +4.6% |
| North Norfolk | £865 | +4.0% |
| Great Yarmouth | £841 | +7.1% |
South Norfolk’s rise is the second slowest in the county, after Norwich.
A correction to our July figure
When we reported the July index on 21 September, we published an average of £311,587 and an annual rise of 1.5%.
The Land Registry has since revised July to £310,063, an annual rise of 1.0%. That is £1,524 lower than the figure we published. We have added a note to that article.
Revisions like this are normal. The index is recalculated as more completed sales are registered, and the latest months are the least settled. August’s £307,735 will move too.
What it means for you
- If you are selling, the district average is lower than a year ago. The fall is small, but the market is not rising.
- If you are buying a flat, prices have dropped by £3,525 on average. Flats now average £133,133 in South Norfolk.
- If you rent, expect rises to continue. The average South Norfolk rent went up £31 a month over the year.
- Do not treat this as a valuation. This is one mean average for a district that runs from Costessey to Harleston. Our Wymondham house prices page shows what homes in the town actually sell for, by type.
- The number may change. July was revised down by £1,524 after we published it.
See also our council tax bands page for what each band costs in Wymondham and the surrounding parishes.
Sources
- HM Land Registry, UK House Price Index full file, August 2026, published 21 October 2026, read on 22 October 2026: the South Norfolk average, monthly and annual changes, index values, property types and first-time buyer average; the revised monthly series from August 2025 and the revised July figure; the January 2023 base month; the figures for the six other Norfolk districts, Mid Suffolk, Norfolk, the East of England and England.
- ONS, Housing prices in South Norfolk, read on 22 October 2026: the September 2026 average rent, the change on a year, rents by bedroom number and the East of England comparison.
- ONS local housing prices pages for Broadland, Norwich, Breckland, King’s Lynn and West Norfolk, North Norfolk and Great Yarmouth, read on 22 October 2026, for the district rent comparison.
- Our own report of the July 2026 index, published 21 September 2026, for the July figures now revised.
Have your say