
1,950 people in South Norfolk claimed jobless benefits in September, 2.3% of working-age residents. Under-25s and over-50s make up almost all of the rise.
1,950 people in South Norfolk were claiming unemployment-related benefits in September 2026. That is 2.3% of residents aged 16 to 64.
The figure is 135 higher than in September 2025, a rise of 7.4%. It is 10 lower than in August.
The numbers are the ONS claimant count, published on 20 October. It counts people on Jobseeker’s Allowance and people on Universal Credit who are required to look for work. All figures are rounded to the nearest five.
Flat this year, higher than last
The count rose through the winter and peaked at 2,055 in February 2026, the highest month in the two years shown below. It eased in the spring and has sat between 1,940 and 1,960 since June.
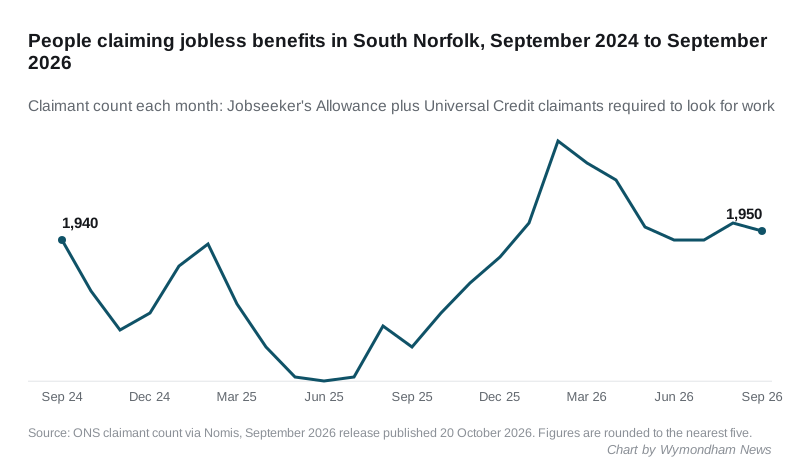
September’s 1,950 is close to the 1,940 recorded in September 2024. The count dipped in 2025, falling to 1,775 in June, so the rise on a year partly reflects that dip.
Who is claiming
Almost all of the rise over the year is at the two ends of the working-age range.
| Age | September 2025 | September 2026 | Change |
|---|---|---|---|
| 16 to 24 | 380 | 450 | +70 |
| 25 to 49 | 995 | 1,000 | +5 |
| 50 and over | 440 | 500 | +60 |
| All ages | 1,815 | 1,950 | +135 |
People aged 16 to 24 now make up almost a quarter of South Norfolk’s claimants.
Wymondham sits below the district rate
The ONS also publishes the count for each of South Norfolk’s 26 wards, on the boundaries in use since May 2025. Wymondham’s three wards had 260 claimants between them in September, the same total as in August.
| Ward | Claimants | Share of 16-64s |
|---|---|---|
| Central Wymondham | 65 | 2.2% |
| North Wymondham | 100 | 2.2% |
| South Wymondham | 95 | 2.1% |
| Hethersett | 105 | 1.9% |
All four are under the district rate of 2.3%. Hethersett’s count fell by 15 on the month.
The highest rates are in the south of the district. Diss and Roydon, about 15 miles south of Wymondham, has the highest rate of any ward:
- Diss and Roydon: 225 claimants, 3.6%
- Harleston: 105 claimants, 3.2%
- Easton: 40 claimants, 3.1%
- Loddon and Chedgrave: 100 claimants, 2.9%
The lowest rates are in Brooke (20 claimants, 1.0%), Wicklewood (25, 1.1%) and Hempnall (25, 1.2%).
The ward figures are rounded to the nearest five, so they add up to slightly more than the district total. Small wards can move by five or ten in a month without anything changing on the ground. Nomis holds no year-earlier figures on the new ward boundaries, so we cannot compare the wards with September 2025.
How South Norfolk compares
South Norfolk has the second lowest claimant rate of Norfolk’s seven districts, after Broadland.
| Area | September 2026 | Rate | Change in a year |
|---|---|---|---|
| Broadland | 1,665 | 2.1% | +95 |
| South Norfolk | 1,950 | 2.3% | +135 |
| Breckland | 2,185 | 2.6% | +230 |
| North Norfolk | 1,460 | 2.7% | +105 |
| King’s Lynn and West Norfolk | 2,650 | 3.0% | +230 |
| Norwich | 4,195 | 4.1% | +190 |
| Great Yarmouth | 2,800 | 4.8% | +285 |
| Norfolk | 16,910 | 3.1% | +1,275 |
| England | 1,493,875 | 4.1% | +37,810 |
Every Norfolk district is higher than a year ago. South Norfolk’s 7.4% rise is faster than England’s 2.6%, but slower than Norfolk’s 8.2%.
What it means for you
- If you are looking for work, the local picture is better than most of the country. South Norfolk’s rate of 2.3% compares with 4.1% across England.
- Young people are bearing more of it. Claimants aged 16 to 24 rose by 70 over the year, more than any other age group.
- The count is not the same as unemployment. It includes some people on Universal Credit who have low-paid work and are required to look for more, so it moves with benefit rules as well as jobs.
Sources
- ONS claimant count, dataset NM_162_1, via Nomis, September 2026 release, last updated 20 October 2026, read on 22 October 2026: the South Norfolk count and rate, the monthly series from September 2024, the breakdown by age, the 26 ward counts and rates (wards as of May 2025), and the figures for the six other Norfolk districts, Norfolk and England.
Have your say